Summary of Current Chattanooga TN-GA Single Family Rental Market According to the Burns Single Family Rent Index™
Source: https://jbrec.com/
| Metrics | 2018 | 2019 | 2020 | 2021 | 2022 | 2023 | Current |
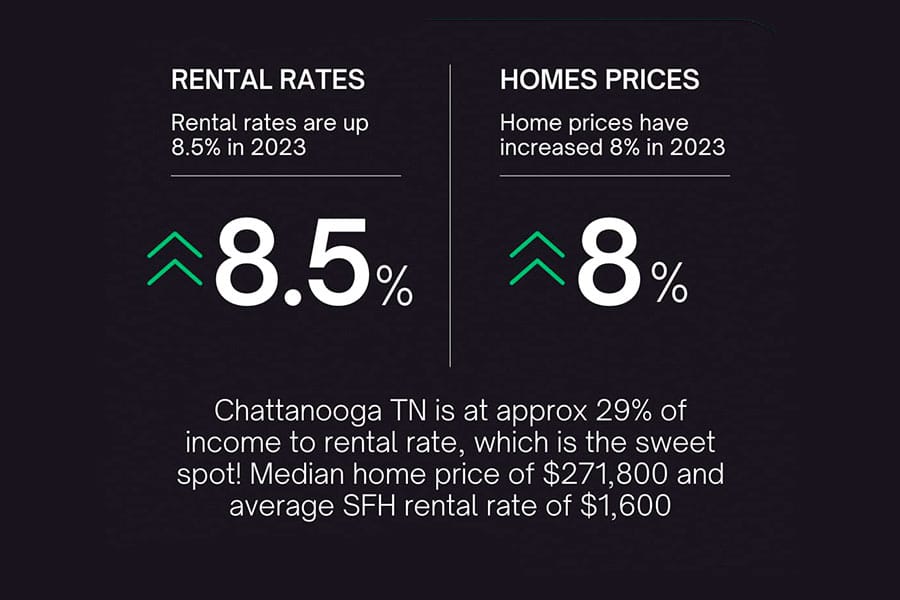
| Median SF Rent -Burns SF Rent Index™ | $1,220 | $1,247 | $1,298 | $1,386 | $1,475 | $1,600 | $1,618 |
| YOY Growth % | 4.7% | 2.2% | 4.1% | 6.8% | 6.4% | 8.5% | 10.6% |
| Burns Home Value Index™ | 6.4% | 7.4% | 11.9% | 22.3% | 9.3% | 8.0% | 8.3% |
| Existing Median Home Price | $159,400 | $177,000 | $195,200 | $221,900 | $255,800 | n/a | $271,800 |
| SF Rent-to-Income Ratio | 27.4% | 26.4% | 26.4% | 26.7% | 27.6% | 28.7% | 29.2% |


